Activity Detecting - Mobile Sensing
2023 Spring Team Project
 IlMinChoIlMinCho
Team Member: Ilmin, Owen, Arman
Activity Detecting: Through the sensor logger application, we developed an application that detects running, jumping, walking, and sitting activities in real time based on the acceleration sensor.
Fall Detecting: In a significant advancement for personal safety technology, this project has led to the development of an fall detection system. This state-of-the-art system is specifically designed to assist the elderly and those living alone, employing advanced sensor technology to differentiate between normal activities and falls. At its core, the system utilizes accelerometer to analyze movement patterns accurately. A critical feature is the implementation of a low pass filter, effectively isolating significant movements and removing irrelevant high-frequency noise. The system's precision is further enhanced by dynamic thresholding, with movement peak thresholds being adjusted in real-time based on the data's running mean and standard deviation.
The meticulous approach to data collection and analysis is a cornerstone of this project. An extensive dataset comprising 200 fall scenarios, including various types of falls, and 200 non-fall scenarios, such as walking and jumping, was compiled to ensure comprehensive coverage of potential movements. The team also conducted detailed research to determine the most effective placement of the smartphone on the user’s body for optimal data accuracy. This project not only marks a technological breakthrough in elderly care but also paves the way for future innovations in health and safety monitoring. With a focus on continuous improvement and adaptation, this fall detection system promises to enhance personal safety and independence for vulnerable populations, demonstrating the profound impact of technology in improving everyday lives.
Activity Detecting:
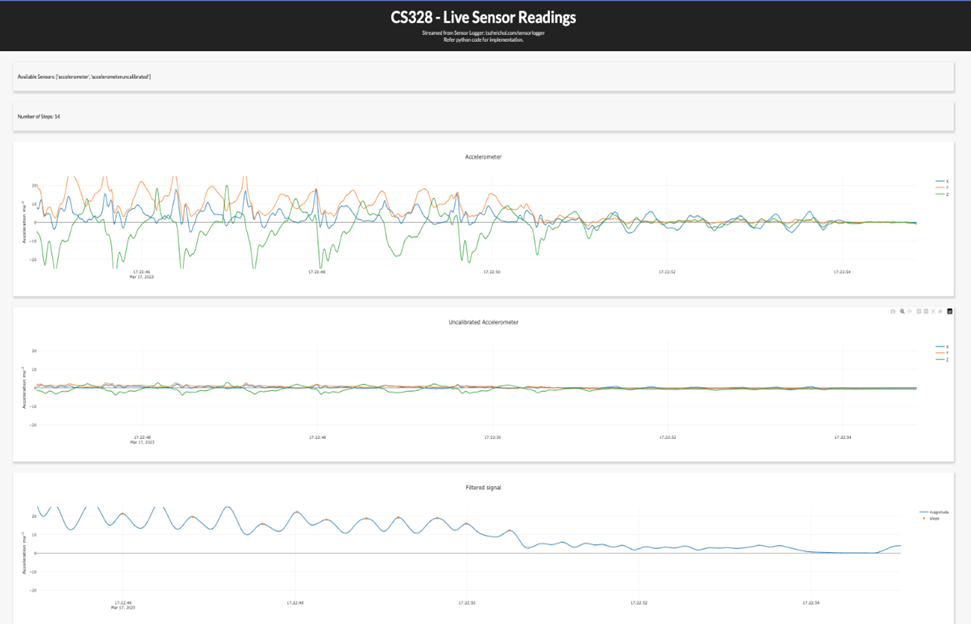
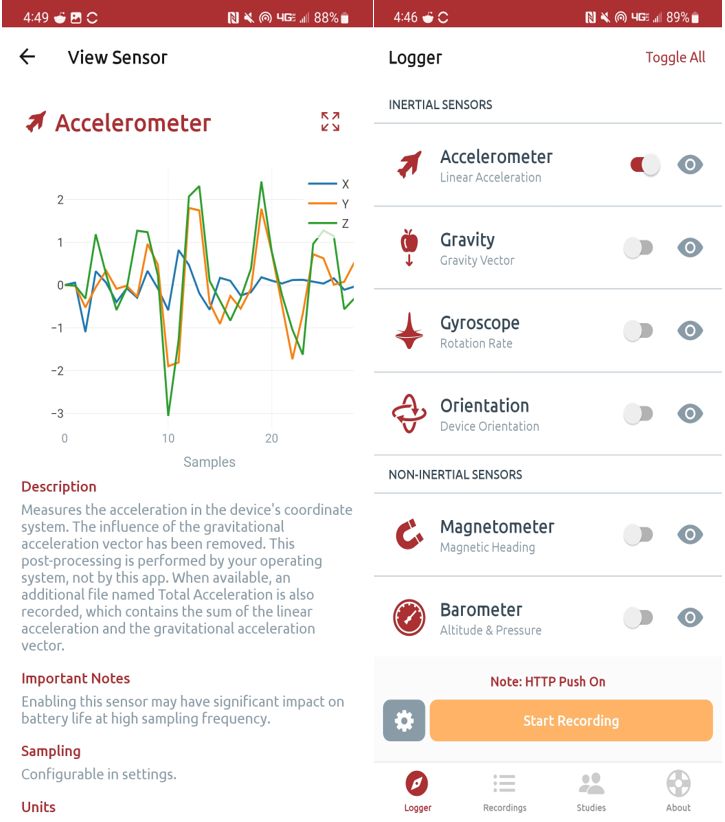
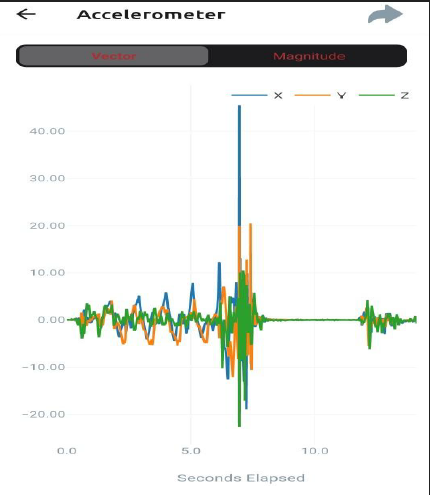
It detects running, jumping, walking, and sitting in real time by linking the sensor logger application and our development program. Overall, based on the acceleration sensor, detection is done through the data we collected and preprocessed, and you can see acceleration and filtered signals in real time.
Data Acquisition and Preprocessing
- Activity Selection: Chose four activities for classification, including sitting and walking, running and jumping.
- Data Collection: Used the Sensor Logger app to record accelerometer data for each activity. Ensured a minimum of 5 minutes of data per activity, maintaining equal data length across activities.
- Data Preparation: Exported recordings as Zipped CSV files, unzipped and renamed (e.g., “Walking-Accelerometer.csv”), and consolidated them into a single CSV file using a custom Python script.
Feature Extraction
- Feature Extraction (features.py): Developed functions to extract statistical, FFT, and other relevant features from the accelerometer data.
- Statistical Features
- Description: Extracted fundamental statistical measures such as mean, variance, zero- or mean-crossings rate, as well as minimum, maximum, and median values.
- Application: Applied these measures to each axis and the magnitude of acceleration, focusing on signals most informative for differentiating activities.
- Tools: Utilized numpy for calculating comprehensive statistical features, including histogram-based analyses.
- FFT (Fast Fourier Transform) Features
- Purpose: Identified dominant frequencies in the accelerometer signal to distinguish between activities, such as differentiating running from walking.
- Method: Implemented numpy’s
rfft()function for real-valued Discrete Fourier Transform, analyzing each axis and magnitude separately. - Consideration: Addressed the complex nature of FFT output by focusing on real components.
- Entropy and Other Features
- Entropy Calculation: Computed entropy using numpy’s
histogram()function to create a discrete distribution of accelerometer values.
∑_(p(x)) p(x) log(p(x)) - Integration of Acceleration: Experimented with deriving velocity and distance signals from acceleration data, mindful of the sensitivity to drift in these calculations.
δv = a δt
δs = 1/2 aδt^2+v_o δt - Challenges and Solutions: Addressed the challenge of large value accumulation in integrated signals by focusing on short-term changes.
- Entropy Calculation: Computed entropy using numpy’s
- Peak Features
- Implementation: Analyzed peaks and troughs in the accelerometer signal to determine the type of activity.
- Specific Techniques: Employed methods such as peak count per window and average duration between peaks.
Fall Detecting:
This project developed an application that detects whether a person has fallen based on the overall acceleration sensor by applying Activity Detecting above.
Data Collection, Model Training, and Testing/ Analysis
We collected 200 samples related to fall based on acceleration using a sensor logger application. Each data is less than 1 minute long, and the first 30 seconds are based on general movements such as walking or standing, then falling down, and then lying down on the floor for 10 to 15 seconds. Then, it went through a process of labeling the fallen section for each data, and removed unnecessary high frequencies in the data by using a low-pass filter.
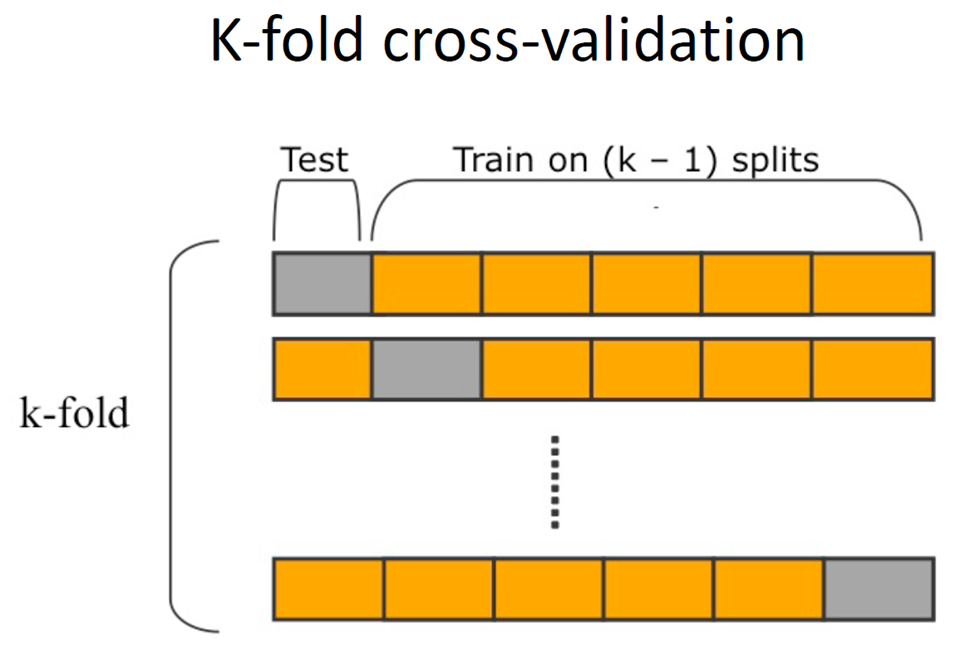
Overall, based on the acceleration information for each axis, the model was trained and fall was detected using the features of Mean, Variance, Minimum, Maximum, Median, Dominant frequency, Entropy, and Number of peaks. Additionally, 10 fold cross validation and decision trees were generated.
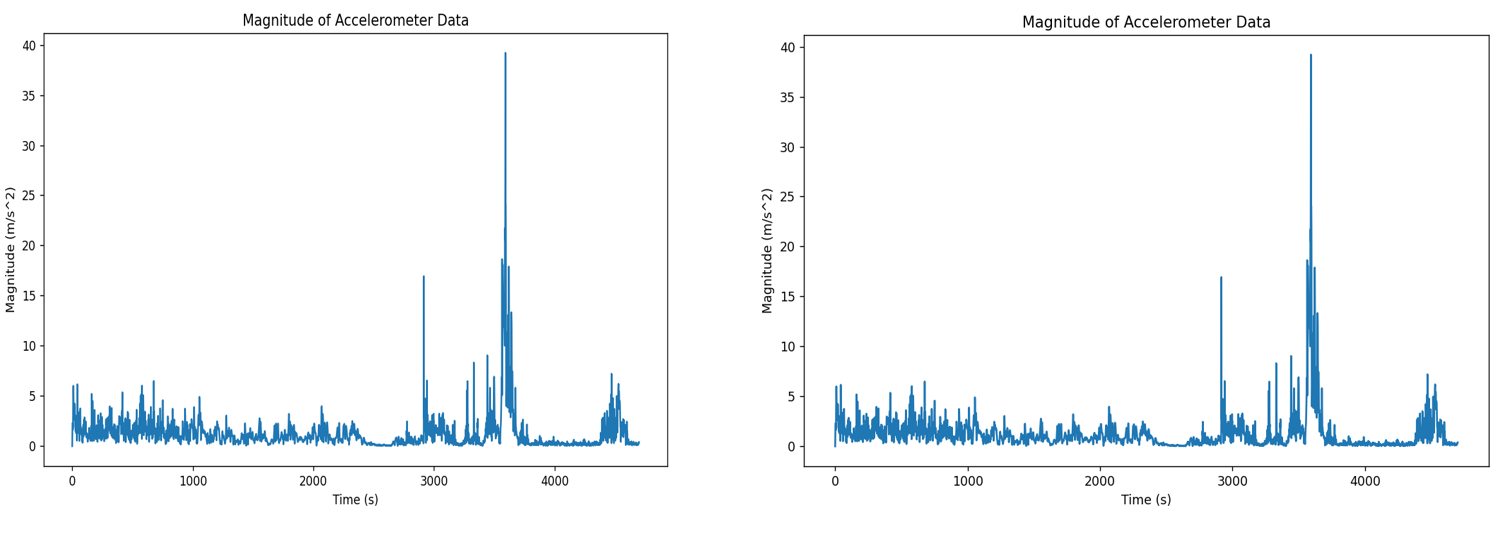
To perform the data smoothing process, Low-pass filter, one of the Freq-domain Filtering methods, was applied.
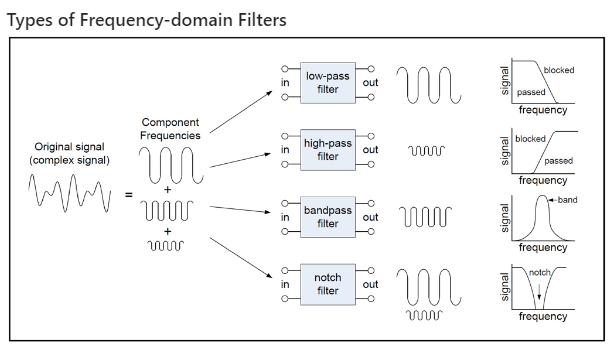
- Low-pass filter: A low-pass filter passes signals with frequency lower than a certain cutoff frequency and attenuates (i.e. reduces the effect of) signals that are higher than the cutoff frequency. An example where a low-pass filter is used is to remove baseline variations in an ECG signal
Classifier Training : Utilized the Decision Tree Classifier with 10-fold cross-validation. Implemented metrics like accuracy, precision, and recall to evaluate the model.
- Data labeling: The initial step involved classifying the activity of the fall, which was used to decode the classifier's predictions. It is based on labeling each data by time, taking into account the section where the person fell and the section where the person is lying on the floor.
- Data Windowing Strategy: A critical decision was to label data windows based on the midpoint label, streamlining the classification process.
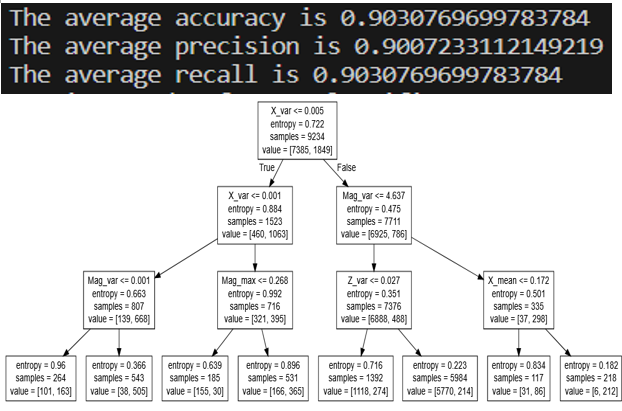
- Classifier Training and Validation: Utilizing the scikit-learn library, I trained a decision tree classifier using a 10-fold cross-validation approach (model_selection.KFold), ensuring a robust evaluation of the model.
The classifier was configured with entropy as the criterion and a depth cap of 3, balancing complexity and computational efficiency.
- Performance Analysis: By employing the fit and predict functions, I trained the model and made predictions on the test data. I then used a confusion matrix to evaluate the accuracy, precision, and recall of the model, providing a comprehensive assessment of its performance.
- Visualization and Finalization: The decision tree was visualized using export_graphviz, creating an insightful representation of the model's decision-making process. A PNG image of the tree was generated using Graphviz, offering a clear visual understanding of the classifier's structure.
- Saving the Classifier: The final classifier was saved using pickle, ensuring that the trained model could be efficiently reused or referenced in future work.
Key learnings
• Data filtering and processing using features such as Maximum, Median, Dominant frequency, Entropy.
• Implement Numpy, scipy, matplotlib and, pandas.
• Sensor logger application
• Training a Decision Tree Classifier
How to Improve the Project Further:
Other sensors, such as gyroscopes, can be used to provide more accurate detection. We only considered falls in everyday situations such as standing or walking, but this can be expanded to include falls during running, cycling, and other activities. Additionally, a process can be applied to detect falls in real time and send a message confirming personal safety.
Reference : https://dganesan.github.io/mhealth-course/