Search Engines - Evaluation

Evaluation
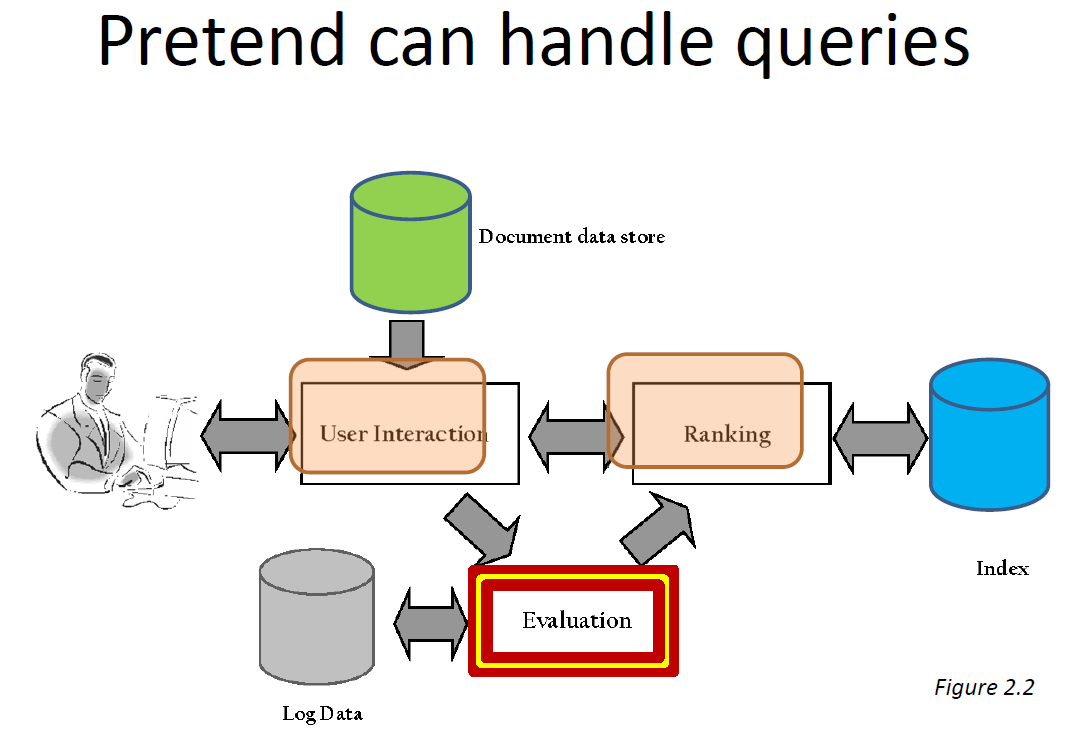
- Evaluation is key to building effective and efficient search engines
– measurement usually carried out in controlled laboratory experiments
– online testing can also be done - Efficiency measures similar to those used in database systems
– e.g., indexing time, query throughput, index size - Our focus here is on effectiveness metrics
– Comparing systems
– Parameter tuning
Evaluation Corpus
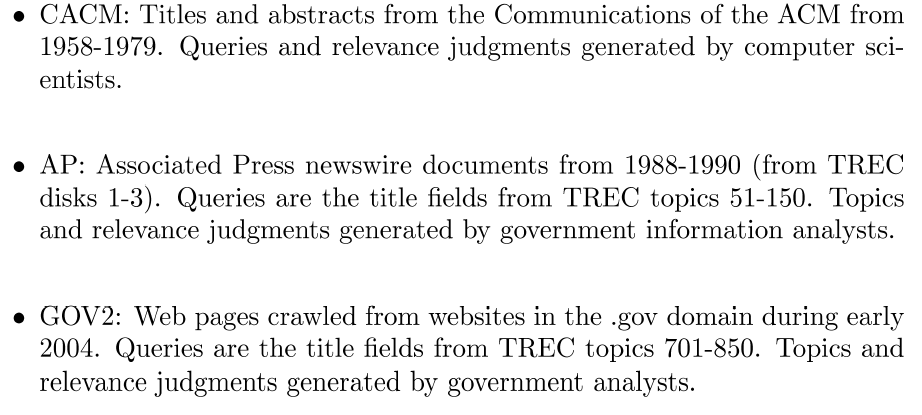
- Test collections consisting of documents, queries, and relevance judgments
- Some examples:
Evaluation Measures
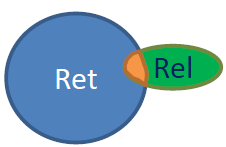
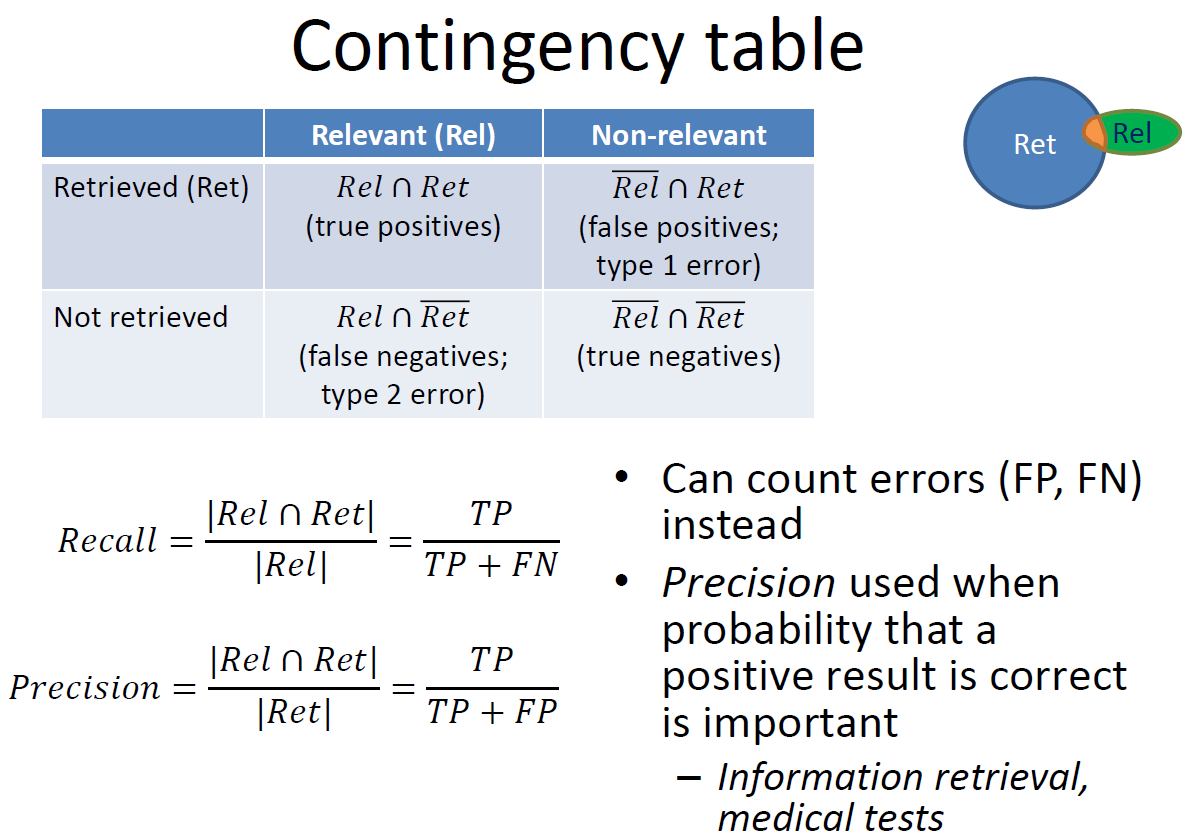
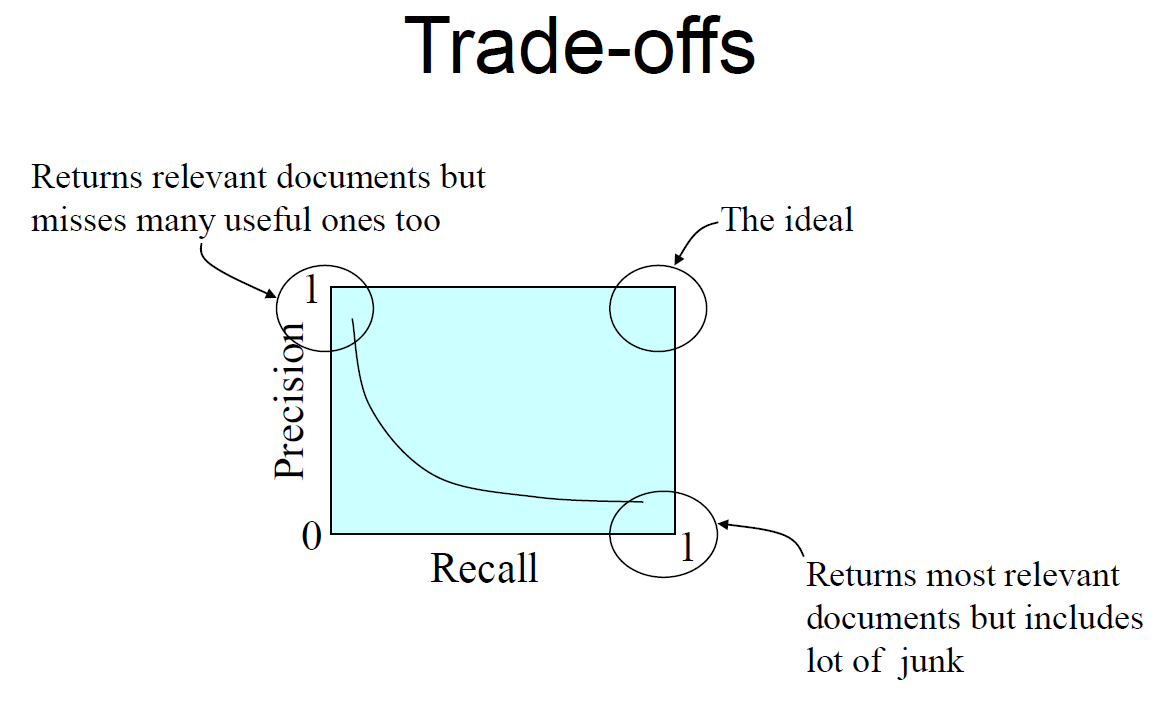
- Precision
– Proportion of a retrieved set that is relevant
– Precision = |relevant ∩ retrieved| ÷ |retrieved|
= P( relevant | retrieved ) - Recall
– proportion of all relevant documents in the collection included in the retrieved set
– Recall = |relevant ∩ retrieved| ÷ |relevant| = P( retrieved | relevant )
EX) Precision and Recall example
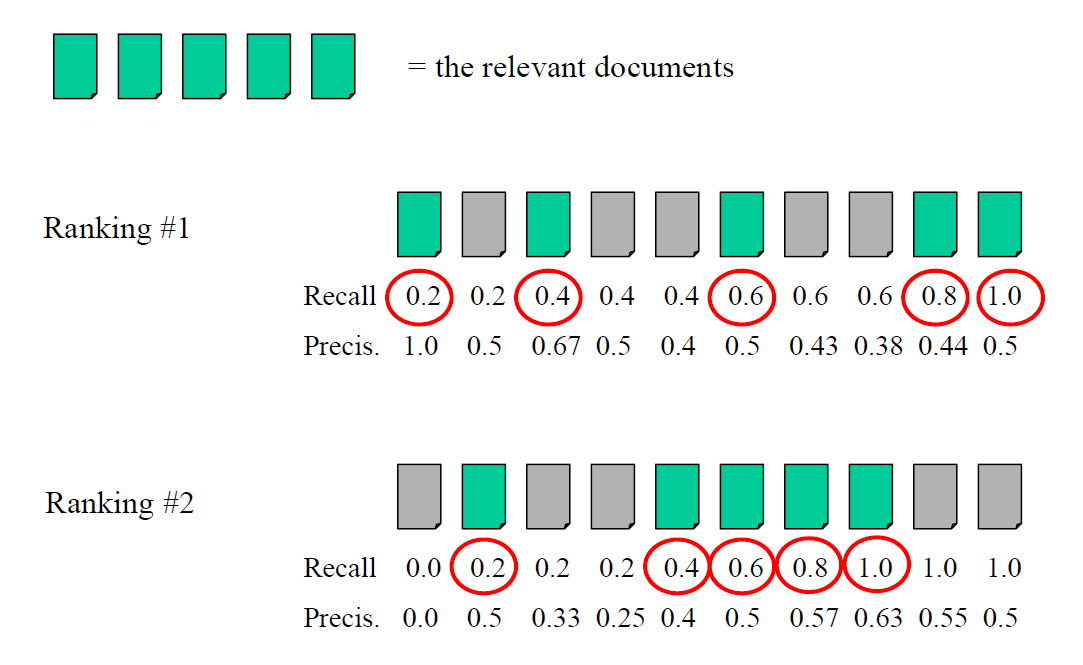
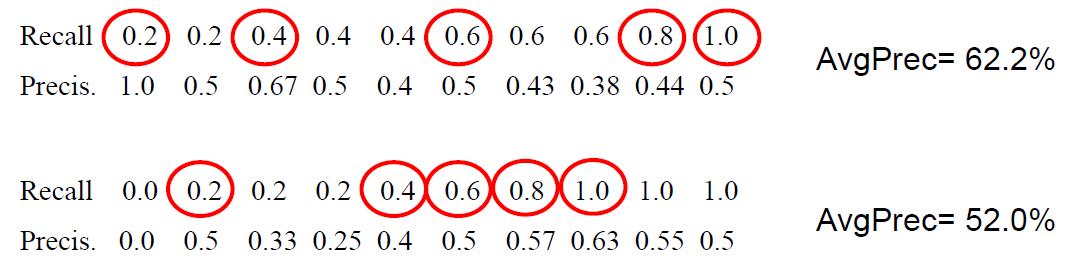
Average precision of a query
- Provides a single-number effectiveness measure
– E.g., for a machine-learning algorithm to detect improvement - Average precision is widely used in IR
– assumes user interested in finding many relevant documents for each query, preferably at top of list
– requires many relevance judgments in text collection - Calculate by averaging precision when recall increases
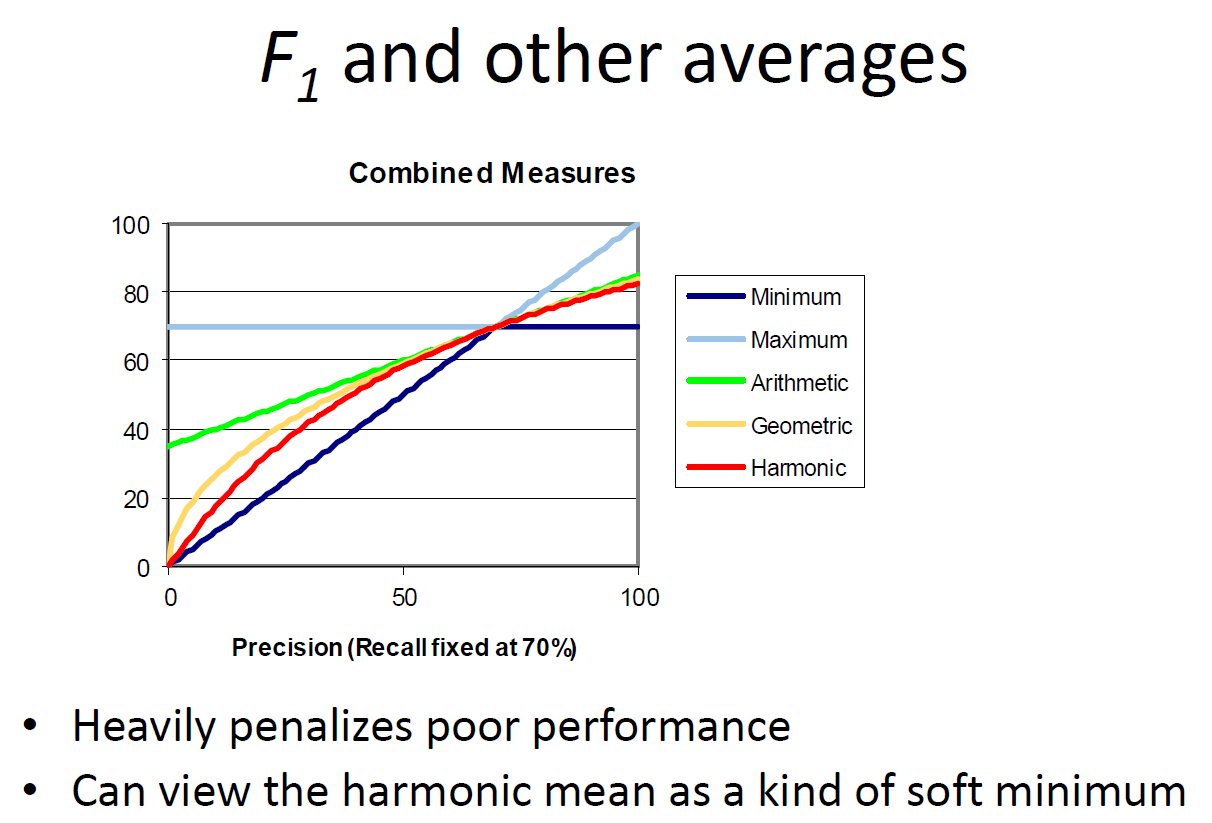
Another average: F Measure
- Harmonic mean of recall and precision
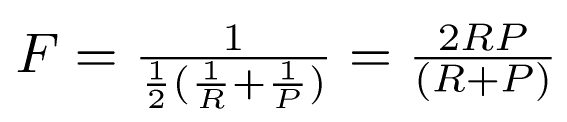
– harmonic mean emphasizes the importance of small values, whereas the arithmetic mean is affected more by outliers that are unusually large - More general form (for those who are curious)
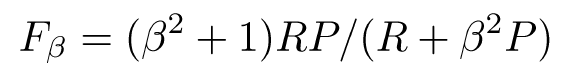
– β is a parameter that determines relative importance of recall and precision
– People usually use balanced F1 measure
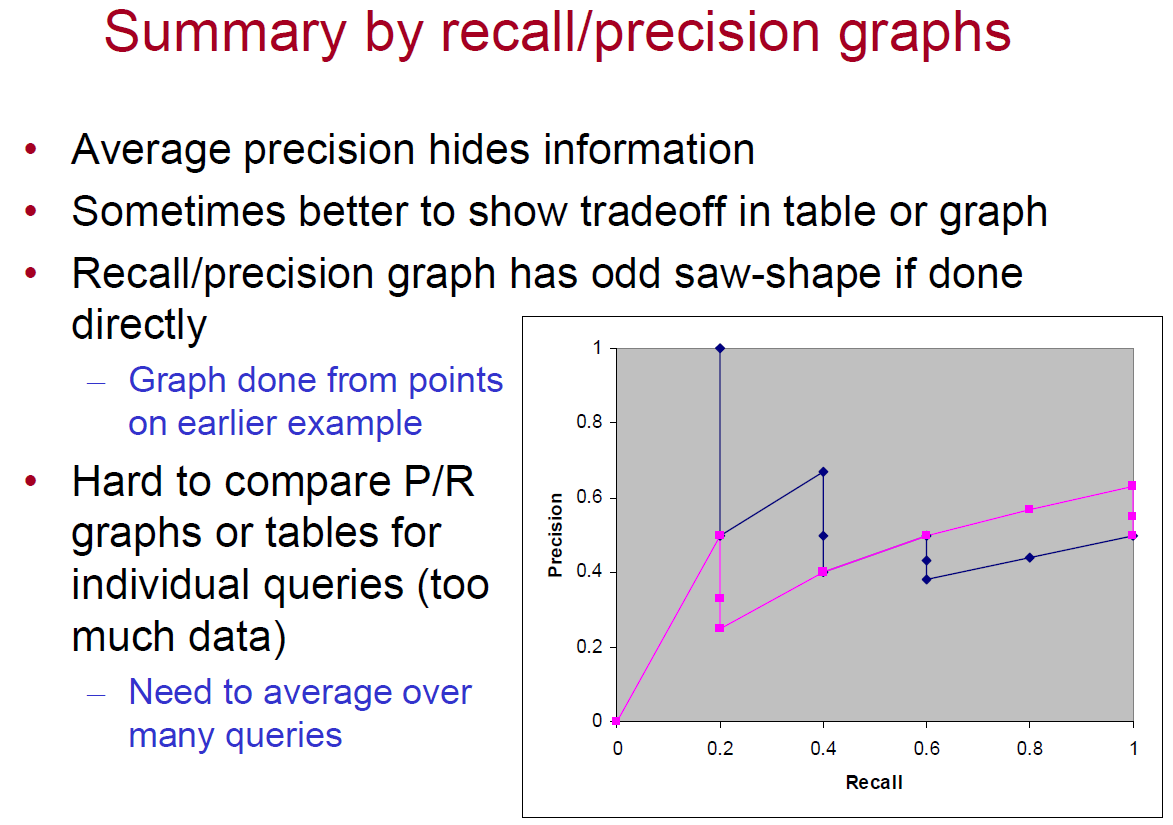
Averaging across queries
- Two main types of averaging
– Micro-average - each relevant document is a point in the average
– Macro-average - each query is a point in the average - Also done with average precision value
– Average of many queries’ average precision values
– Called mean average precision (MAP)/ “Average average precision” sounds weird
Discounted Cumulative Gain (DCG)
- Popular measure for evaluating web search and related tasks
- Two assumptions:
- Highly relevant documents are more useful than marginally relevant document
-> Implies we need multi-valued relevance judgments - The lower the ranked position of a relevant document, the less useful it is for the user, since it is less likely to be examined
-> AP captures this, too, but normally binary judgments
- Uses graded relevance as a measure of the usefulness, or gain, from examining a document
- Gain is accumulated starting at the top of the ranking and may be reduced, or discounted, at lower ranks
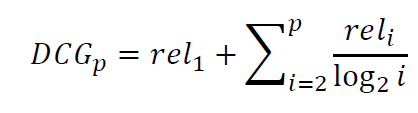
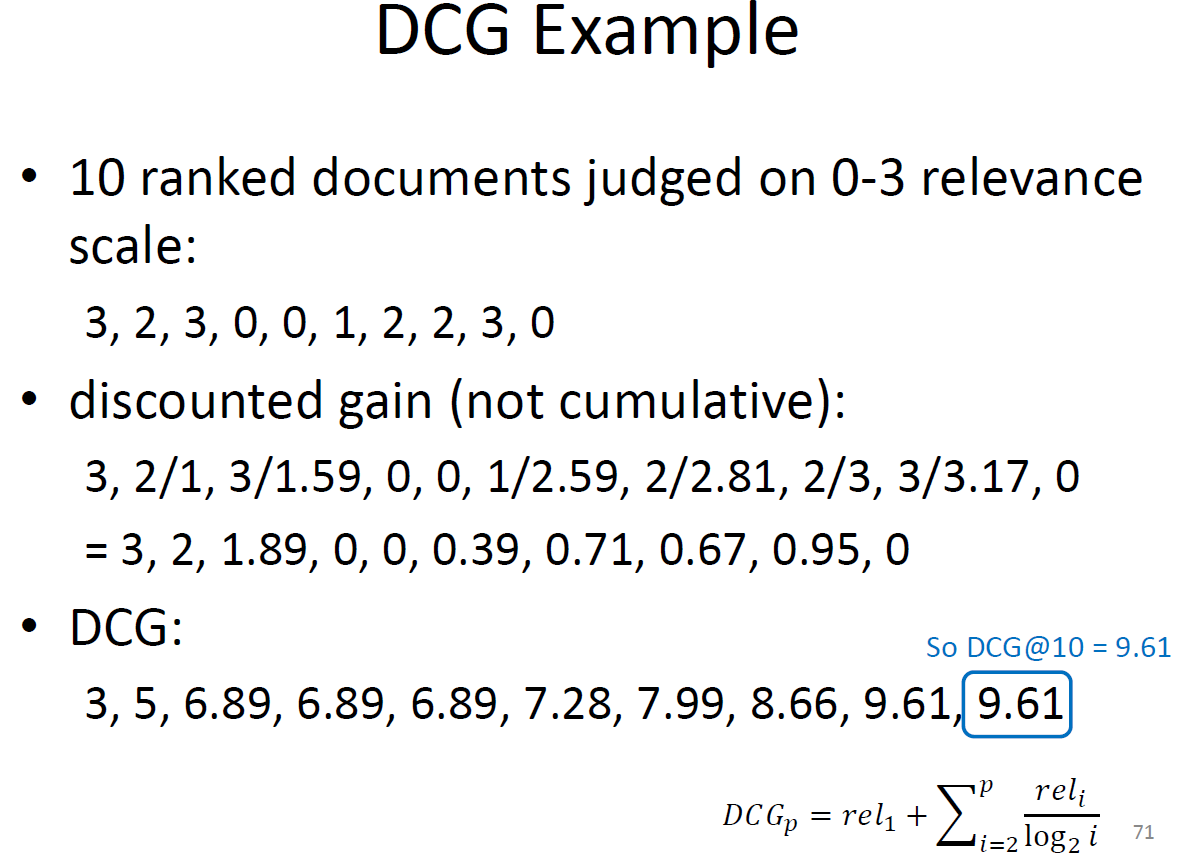
- Typical discount is 1/log (rank)
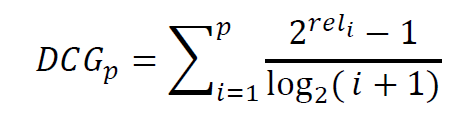
– With base 2, the discount at rank 4 is 1/2, and at rank 8 it is 1/3 - DCG is the total gain accumulated at a particular rank p:
- Alternative formulation:
– used by some web search companies
Normalized DCG (NDCG)
- DCG numbers are averaged across a set of queries at specific rank values
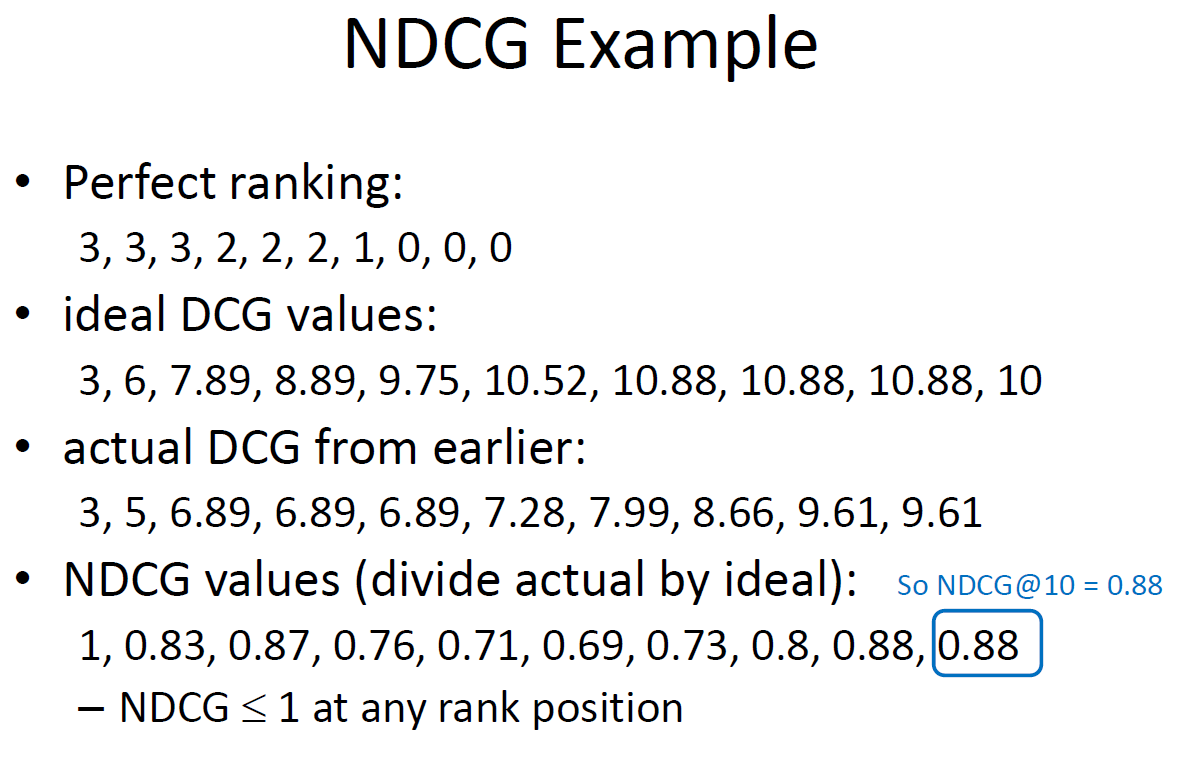
– e.g., DCG at rank 5 is 6.89 and at rank 10 is 9.61 - DCG values are often normalized by comparing the DCG at each rank with the DCG value for the ideal (perfect) ranking
– makes averaging easier for queries with different numbers of relevant documents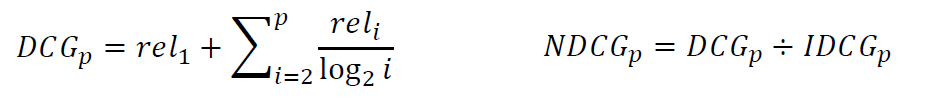
 IlMinCho
Analysis
1.
| Query | QL | BM25 | QL~BM % | DPR | QL~DPR % |
|---|---|---|---|---|---|
| 23849 | 0.0151 | 0.0186 | 23.2% | 0.2391 | 1483.4% |
| 42255 | 0.1987 | 0.2625 | 32.1% | 0.4411 | 122.0% |
| 47210 | 0.1997 | 0.2021 | 1.2% | 0.3692 | 84.9% |
| ... | ... | ... | ... | ... | ... |
| ... | ... | ... | ... | ... | ... |
| ... | ... | ... | ... | ... | ... |
| 1113256 | 0.4953 | 0.4969 | 0.3% | 0.4651 | -6.1% |
| 1115210 | 0.0915 | 0.0887 | -3.1% | 0.0651 | -28.9% |
| 1116380 | 0.0396 | 0.0111 | -72.0% | 0.0587 | 48.2% |
| 1119543 | 0.0000 | 0.0000 | 0.0% | 0.0000 | 0.0% |
| 1121353 | 0.2557 | 0.2349 | -8.1% | 0.1002 | -60.8% |
| 1122767 | 0.3460 | 0.3235 | -6.5% | 0.2052 | -40.7% |
| 1127540 | 0.2693 | 0.2764 | 2.6% | 0.1705 | -36.7% |
| 1131069 | 0.0288 | 0.0856 | 197.2% | 0.2143 | 644.1% |
| 1132532 | 0.1666 | 0.1044 | -37.3% | 0.2442 | 46.6% |
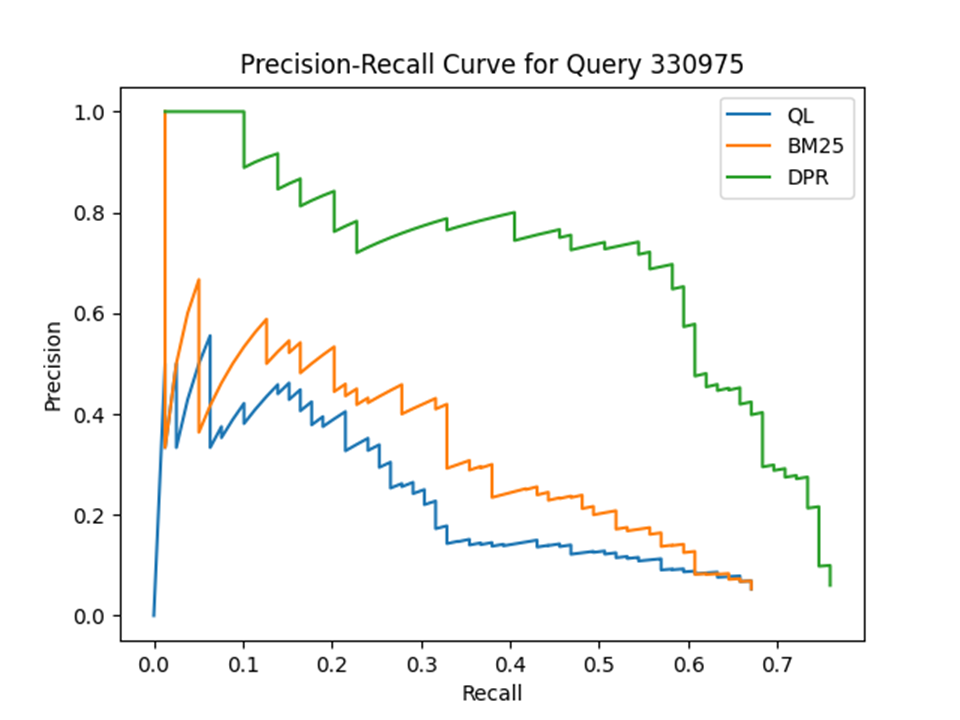
| 1133579 | 0.6677 | 0.6666 | -0.2% | 0.7530 | 12.8% |
| 1136043 | 0.0976 | 0.1569 | 60.8% | 0.3695 | 278.6% |
| 1136047 | 0.0666 | 0.0464 | -30.3% | 0.0623 | -6.5% |
| 1136769 | 0.0000 | 0.0000 | 0.0% | 0.0000 | 0.0% |
| 1136962 | 0.4689 | 0.4879 | 4.1% | 0.4199 | -10.4% |
| all | 0.1952 | 0.1886 | -3.4% | 0.2091 | 7.1% |
2.
Looking at the data, we can find several results with a slightly higher value of BM25 than the value of QL and the highest value of DPR. In other words, the percentage tends to improve gradually. However, if you look at the ‘all’ part row, the values increase in the order of BM25 and Ql, DPR.
It depends on which query you look at, but while QL directly checks the probability of a term appearing in a document, BM25 relies on a more complex combination of features. In other words, QL may be better suited for situations where there is a clear semantic relationship between a query and related documents. However, for other data sets or other types of queries, bm25 may work better.
DPR is a model that uses vectors to encode queries and documents. DPR is more sophisticated than QL and BM25 because it takes advantage of similarities between queries and documents to handle complex queries and documents more effectively.
3.
The MAP is intended to evaluate the efficiency of the search system. Without a retrieved document, it is difficult to find the relevance of the document to the query. As a result, MAP calculation is not easy because precision and recall rate cannot be calculated. This also means that there is nothing to evaluate the efficiency of the system, and MAP calculations for these queries can lead to inaccurate results.
4.
Reference: Prof. James Allan


